Graduate Programs
Graduate Programs
Graduate Programs
Graduate Programs
Graduate Programs
Spearheaded the research and design of Niche's graduate program feature, which helps graduate searchers find and compare Masters or Doctoral programs. The feature increased traffic to Graduate School profiles by over 800% and led to the creation of over 253 featured programs in less than 2 months.
Spearheaded the research and design of Niche's graduate program feature, which helps graduate searchers find and compare Masters or Doctoral programs. The feature increased traffic to Graduate School profiles by over 800% and led to the creation of over 253 featured programs in less than 2 months.
Spearheaded the research and design of Niche's graduate program feature, which helps graduate searchers find and compare Masters or Doctoral programs. The feature increased traffic to Graduate School profiles by over 800% and led to the creation of over 253 featured programs in less than 2 months.
Spearheaded the research and design of Niche's graduate program feature, which helps graduate searchers find and compare Masters or Doctoral programs. The feature increased traffic to Graduate School profiles by over 800% and led to the creation of over 253 featured programs in less than 2 months.
Spearheaded the research and design of Niche's graduate program feature, which helps graduate searchers find and compare Masters or Doctoral programs. The feature increased traffic to Graduate School profiles by over 800% and led to the creation of over 253 featured programs in less than 2 months.
Company
Company
Company
Niche
Niche
Niche
Niche
My Role
My Role
My Role
My Role
My Role
Product Designer
Product Design Lead
Product Designer
Product Designer
Product Designer
Timeline
Timeline
Timeline
8 Months
8 Months
8 Months
8 Months
8 Months
Intro
Intro
Intro
Intro
Grad – the failed vertical
Grad – the failed vertical
Grad – the failed vertical
Grad – the failed vertical
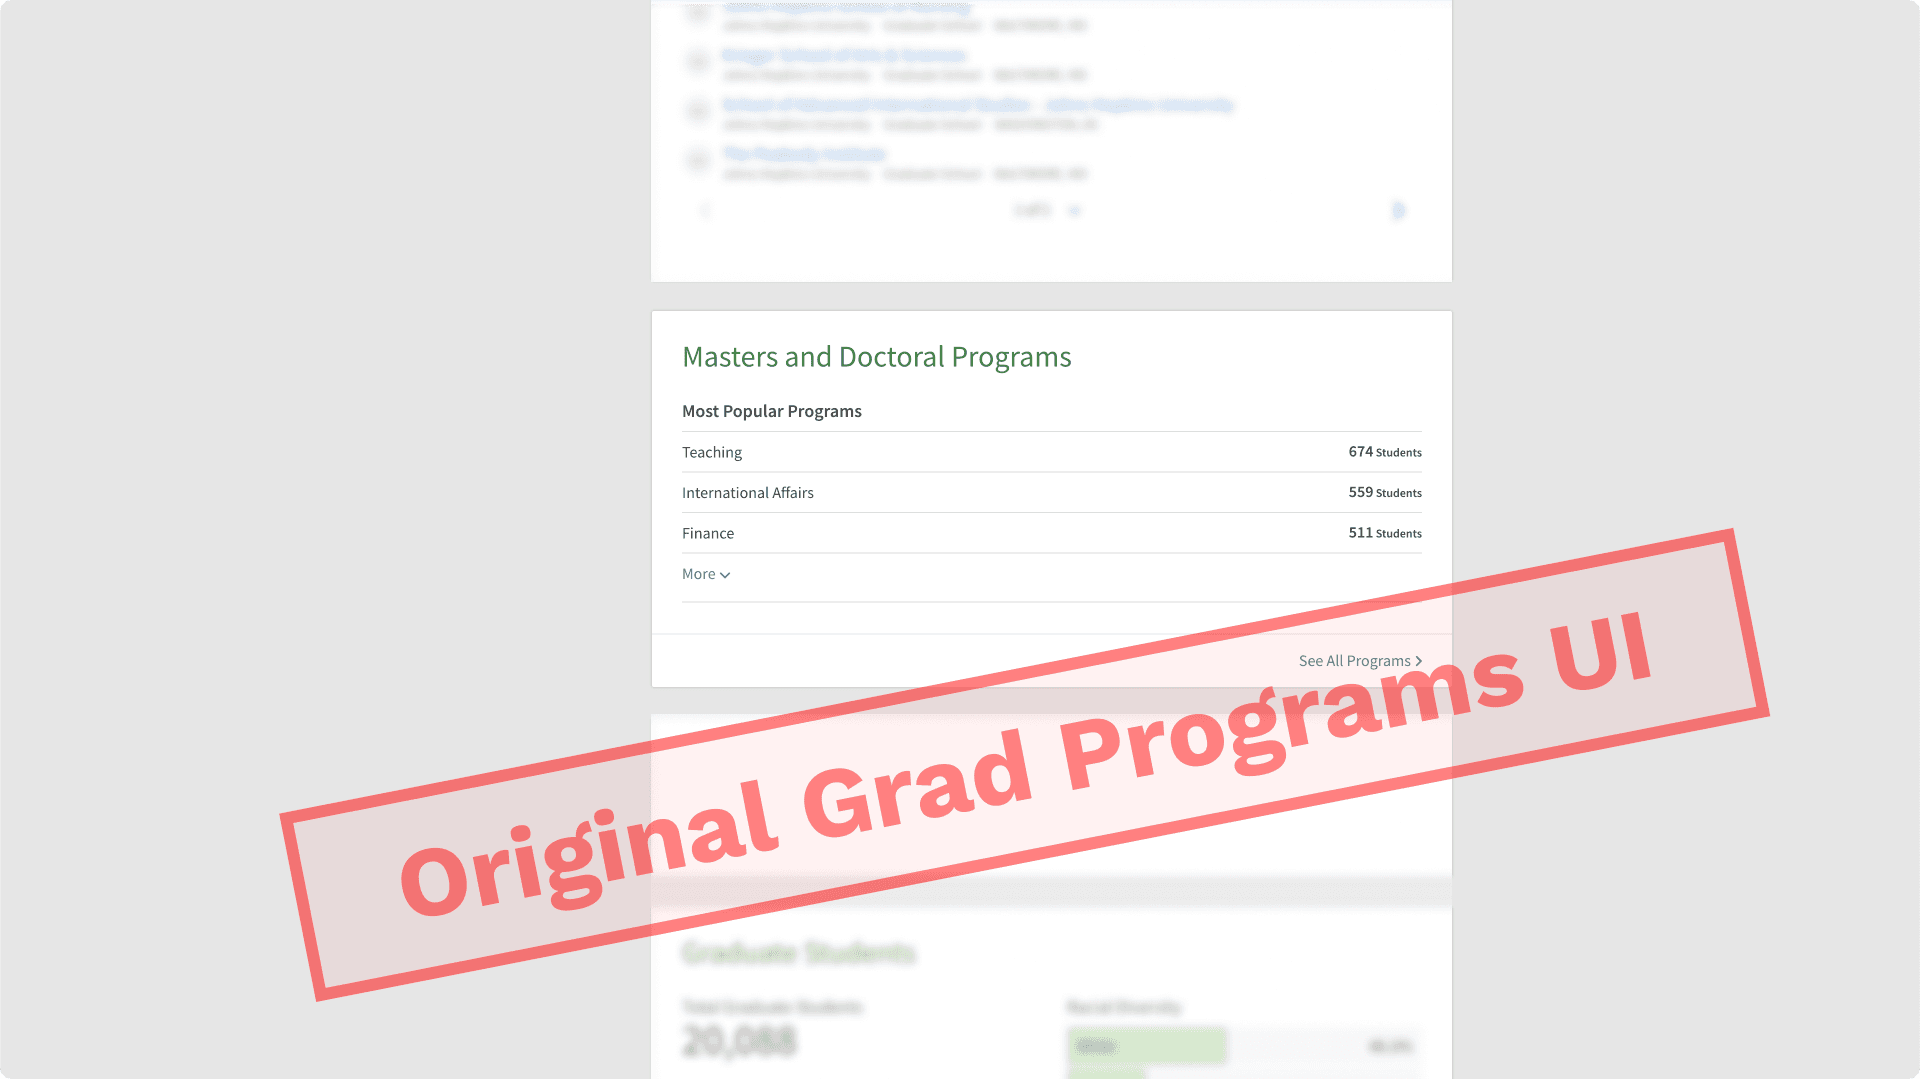
In 2018, Niche noticed a growing trend of people enrolling in graduate or professional programs and decided to create a new vertical specifically for Grad Schools. Unfortunately, their initial approach of copying the college strategy didn't generate much traction or engagement from Grad Schools or searchers, resulting in the Grad vertical being dormant until 2021.
In 2018, Niche noticed a growing trend of people enrolling in graduate or professional programs and decided to create a new vertical specifically for Grad Schools. Unfortunately, their initial approach of copying the college strategy didn't generate much traction or engagement from Grad Schools or searchers, resulting in the Grad vertical being dormant until 2021.
In 2018, Niche noticed a growing trend of people enrolling in graduate or professional programs and decided to create a new vertical specifically for Grad Schools. Unfortunately, their initial approach of copying the college strategy didn't generate much traction or engagement from Grad Schools or searchers, resulting in the Grad vertical being dormant until 2021.
In 2018, Niche noticed a growing trend of people enrolling in graduate or professional programs and decided to create a new vertical specifically for Grad Schools. Unfortunately, their initial approach of copying the college strategy didn't generate much traction or engagement from Grad Schools or searchers, resulting in the Grad vertical being dormant until 2021.
Goal
Goal
Goal
Goal
How might we reimagine the Grad vertical?
How might we reimagine the Grad vertical?
How might we reimagine the Grad vertical?
How might we reimagine the Grad vertical?
The Niche leadership team then tasked the Echo product team with making the Grad vertical viable by increasing student engagement and grad school ARR and ACV. On the surface, the goal seemed simple enough, but it quickly became clear that it would take a complete reimagining of the grad searcher experience to make any significant impact in the space.
The Niche leadership team then tasked the Echo product team with making the Grad vertical viable by increasing student engagement and grad school ARR and ACV. On the surface, the goal seemed simple enough, but it quickly became clear that it would take a complete reimagining of the grad searcher experience to make any significant impact in the space.
The Niche leadership team then tasked the Echo product team with making the Grad vertical viable by increasing student engagement and grad school ARR and ACV. On the surface, the goal seemed simple enough, but it quickly became clear that it would take a complete reimagining of the grad searcher experience to make any significant impact in the space.
The Niche leadership team then tasked the Echo product team with making the Grad vertical viable by increasing student engagement and grad school ARR and ACV. On the surface, the goal seemed simple enough, but it quickly became clear that it would take a complete reimagining of the grad searcher experience to make any significant impact in the space.
300M
300M
300M
300M
300M
Graduate school related google searchers in 2020
79% did not include the name of an institution
3.1M
3.1M
3.1M
3.1M
3.1M
People enrolled in a graduate program in 2020
This was an increase of 10% from the beginning of the decade
Cross-functional Interviews
Cross-functional Interviews
Cross-functional Interviews
Cross-functional Interviews
What's wrong with Grad?
What's wrong with Grad?
What's wrong with Grad?
What's wrong with Grad?
To begin our research, my Product Manager, Nick, and I reviewed all available secondary research, conducted analyses of key competitors, and studied recent Fullstory sessions on grad profiles. These sessions quickly showed us that users associated grad profile pages with a low expected utility and high interaction cost, leading to a high bounce rate and few returning visitors. Luckily, we also discovered that every competitor faced the very same problems.
To further our research, we then interviewed Niche's Customer Support team, Partnership Executives, and Partnership Managers to identify the biggest barriers to making Grad a healthy vertical. Everyone pointed to the same cyclical problem: Niche lacked the content to generate healthy traffic, and the lack of traffic led to little User Generated Content (UGC).
B=M•A•P
B=M•A•P
B=M•A•P
B=M•A•P
How do we get more valuable content?
How do we get more valuable content?
How do we get more valuable content?
How do we get more valuable content?
Based on prior research in their other verticals, the team knew UGC would be the most valuable content, but was also the hardest to obtain. Therefore, the team focused on collecting content from schools, assuming that it would lead to more traffic from users and eventually more UGC. To further this goal, we initially considered giving schools free premium features in exchange for content, but ultimately dismissed the idea as it wouldn't move the bottom line. Instead, the team focused on creating new intuitive features to increase clients' abilities to add content on their programs, which aligned with their existing motivations and pushed them past the activation threshold.
Based on prior research in their other verticals, the team knew UGC would be the most valuable content, but was also the hardest to obtain. Therefore, the team focused on collecting content from schools, assuming that it would lead to more traffic from users and eventually more UGC. To further this goal, we initially considered giving schools free premium features in exchange for content, but ultimately dismissed the idea as it wouldn't move the bottom line. Instead, the team focused on creating new intuitive features to increase clients' abilities to add content on their programs, which aligned with their existing motivations and pushed them past the activation threshold.
Based on prior research in their other verticals, the team knew UGC would be the most valuable content, but was also the hardest to obtain. Therefore, the team focused on collecting content from schools, assuming that it would lead to more traffic from users and eventually more UGC. To further this goal, we initially considered giving schools free premium features in exchange for content, but ultimately dismissed the idea as it wouldn't move the bottom line. Instead, the team focused on creating new intuitive features to increase clients' abilities to add content on their programs, which aligned with their existing motivations and pushed them past the activation threshold.
Based on prior research in their other verticals, the team knew UGC would be the most valuable content, but was also the hardest to obtain. Therefore, the team focused on collecting content from schools, assuming that it would lead to more traffic from users and eventually more UGC. To further this goal, we initially considered giving schools free premium features in exchange for content, but ultimately dismissed the idea as it wouldn't move the bottom line. Instead, the team focused on creating new intuitive features to increase clients' abilities to add content on their programs, which aligned with their existing motivations and pushed them past the activation threshold.
User research
User research
User research
User research
User interviews
User interviews
User interviews
User interviews
To determine what content was most valuable to students, we conducted user research by creating a 50-question survey that was answered by over 6,000 grad searchers. Then we conducted 15 interviews based on demographic info and a first-come-first-serve basis. Emily, an incoming Masters in Social Works student, shared her challenges in comparing grad programs and how she created a personal spreadsheet using each school's website to fill it with information that was important to her.
To determine what content was most valuable to students, we conducted user research by creating a 50-question survey that was answered by over 6,000 grad searchers. Then we conducted 15 interviews based on demographic info and a first-come-first-serve basis. Emily, an incoming Masters in Social Works student, shared her challenges in comparing grad programs and how she created a personal spreadsheet using each school's website to fill it with information that was important to her.
To determine what content was most valuable to students, we conducted user research by creating a 50-question survey that was answered by over 6,000 grad searchers. Then we conducted 15 interviews based on demographic info and a first-come-first-serve basis. Emily, an incoming Masters in Social Works student, shared her challenges in comparing grad programs and how she created a personal spreadsheet using each school's website to fill it with information that was important to her.
To determine what content was most valuable to students, we conducted user research by creating a 50-question survey that was answered by over 6,000 grad searchers. Then we conducted 15 interviews based on demographic info and a first-come-first-serve basis. Emily, an incoming Masters in Social Works student, shared her challenges in comparing grad programs and how she created a personal spreadsheet using each school's website to fill it with information that was important to her.
For each school, I put information about their programs and academics, because there's no centralized place for it. You have to go to each schools website to find the information and compare it.
For each school, I put information about their programs and academics, because there's no centralized place for it. You have to go to each schools website to find the information and compare it.
For each school, I put information about their programs and academics, because there's no centralized place for it. You have to go to each schools website to find the information and compare it.
For each school, I put information about their programs and academics, because there's no centralized place for it. You have to go to each schools website to find the information and compare it.
Define
Define
Define
Define
Affinity maps, empathy maps, and 6p stories
Affinity maps, empathy maps, and 6p stories
Affinity maps, empathy maps, and 6p stories
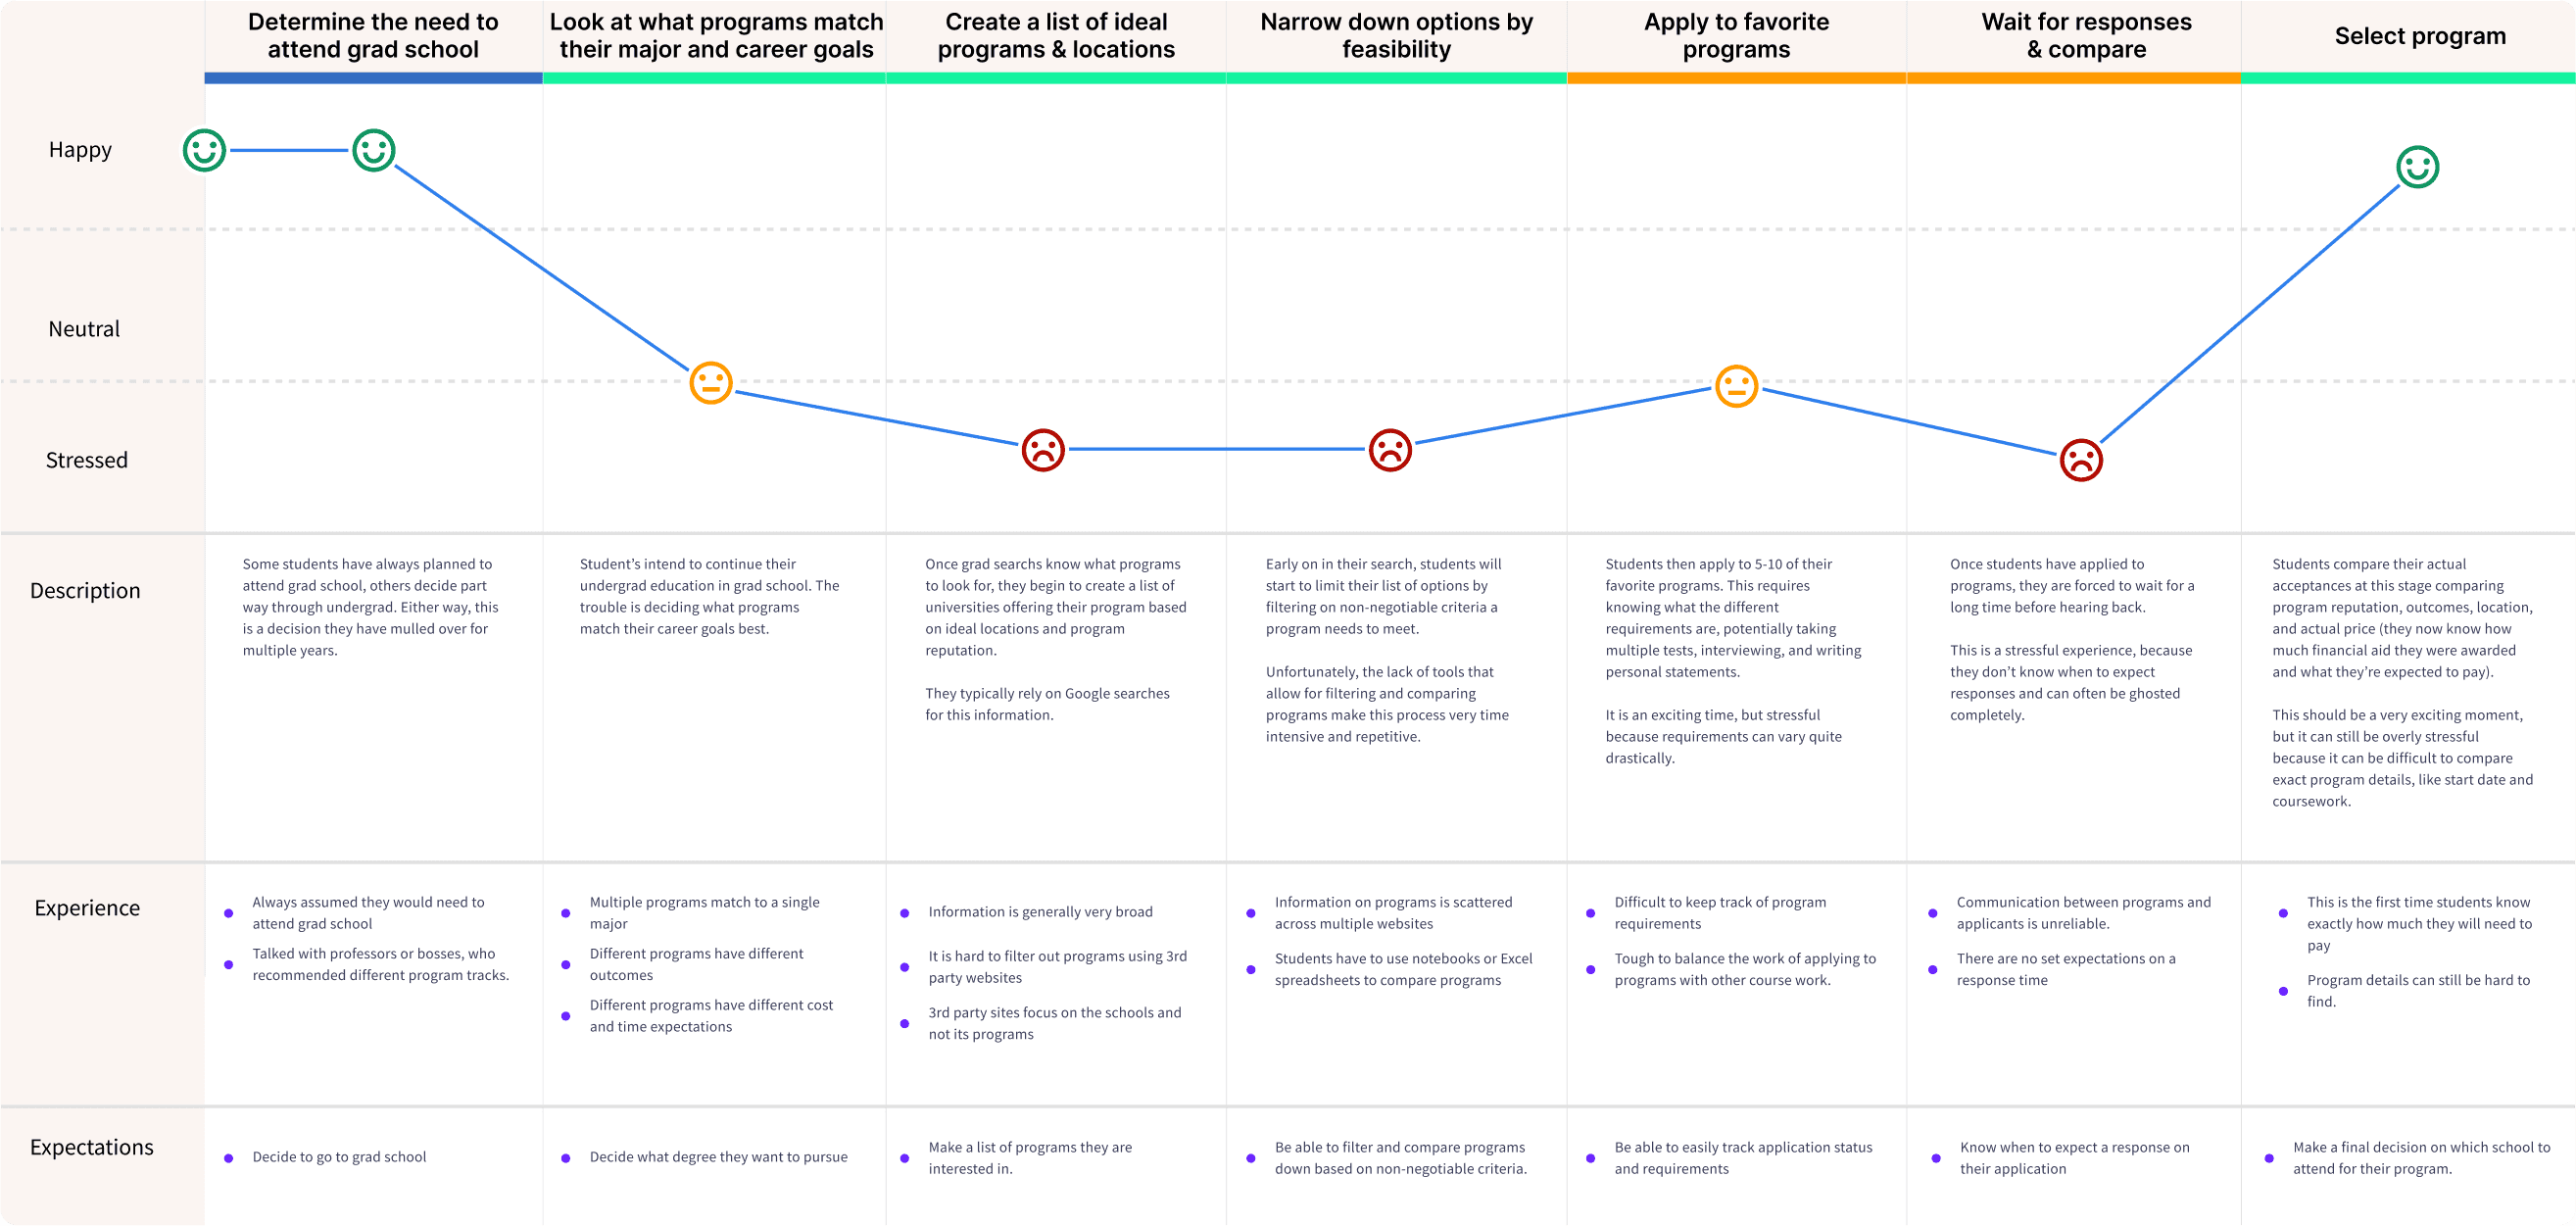
After collecting all of the responses, I worked with Nick to create an affinity map, from which we pulled out common themes and insights from our research. I then used this information to create a user empathy map and a 6p story to represent everything they had learned about grad student searchers. The empathy map shows the critical steps along the journey and the various pain points users expressed, and identifies areas where Niche could make an immediate impact and areas where the product could grow over the coming years.
After collecting all of the responses, I worked with Nick to create an affinity map, from which we pulled out common themes and insights from our research. I then used this information to create a user empathy map and a 6p story to represent everything they had learned about grad student searchers. The empathy map shows the critical steps along the journey and the various pain points users expressed, and identifies areas where Niche could make an immediate impact and areas where the product could grow over the coming years.
After collecting all of the responses, I worked with Nick to create an affinity map, from which we pulled out common themes and insights from our research. I then used this information to create a user empathy map and a 6p story to represent everything they had learned about grad student searchers. The empathy map shows the critical steps along the journey and the various pain points users expressed, and identifies areas where Niche could make an immediate impact and areas where the product could grow over the coming years.
After collecting all of the responses, I worked with Nick to create an affinity map, from which we pulled out common themes and insights from our research. I then used this information to create a user empathy map and a 6p story to represent everything they had learned about grad student searchers. The empathy map shows the critical steps along the journey and the various pain points users expressed, and identifies areas where Niche could make an immediate impact and areas where the product could grow over the coming years.
Defining the new experience
Defining the new experience
Defining the new experience
Defining the new experience
Featured Programs
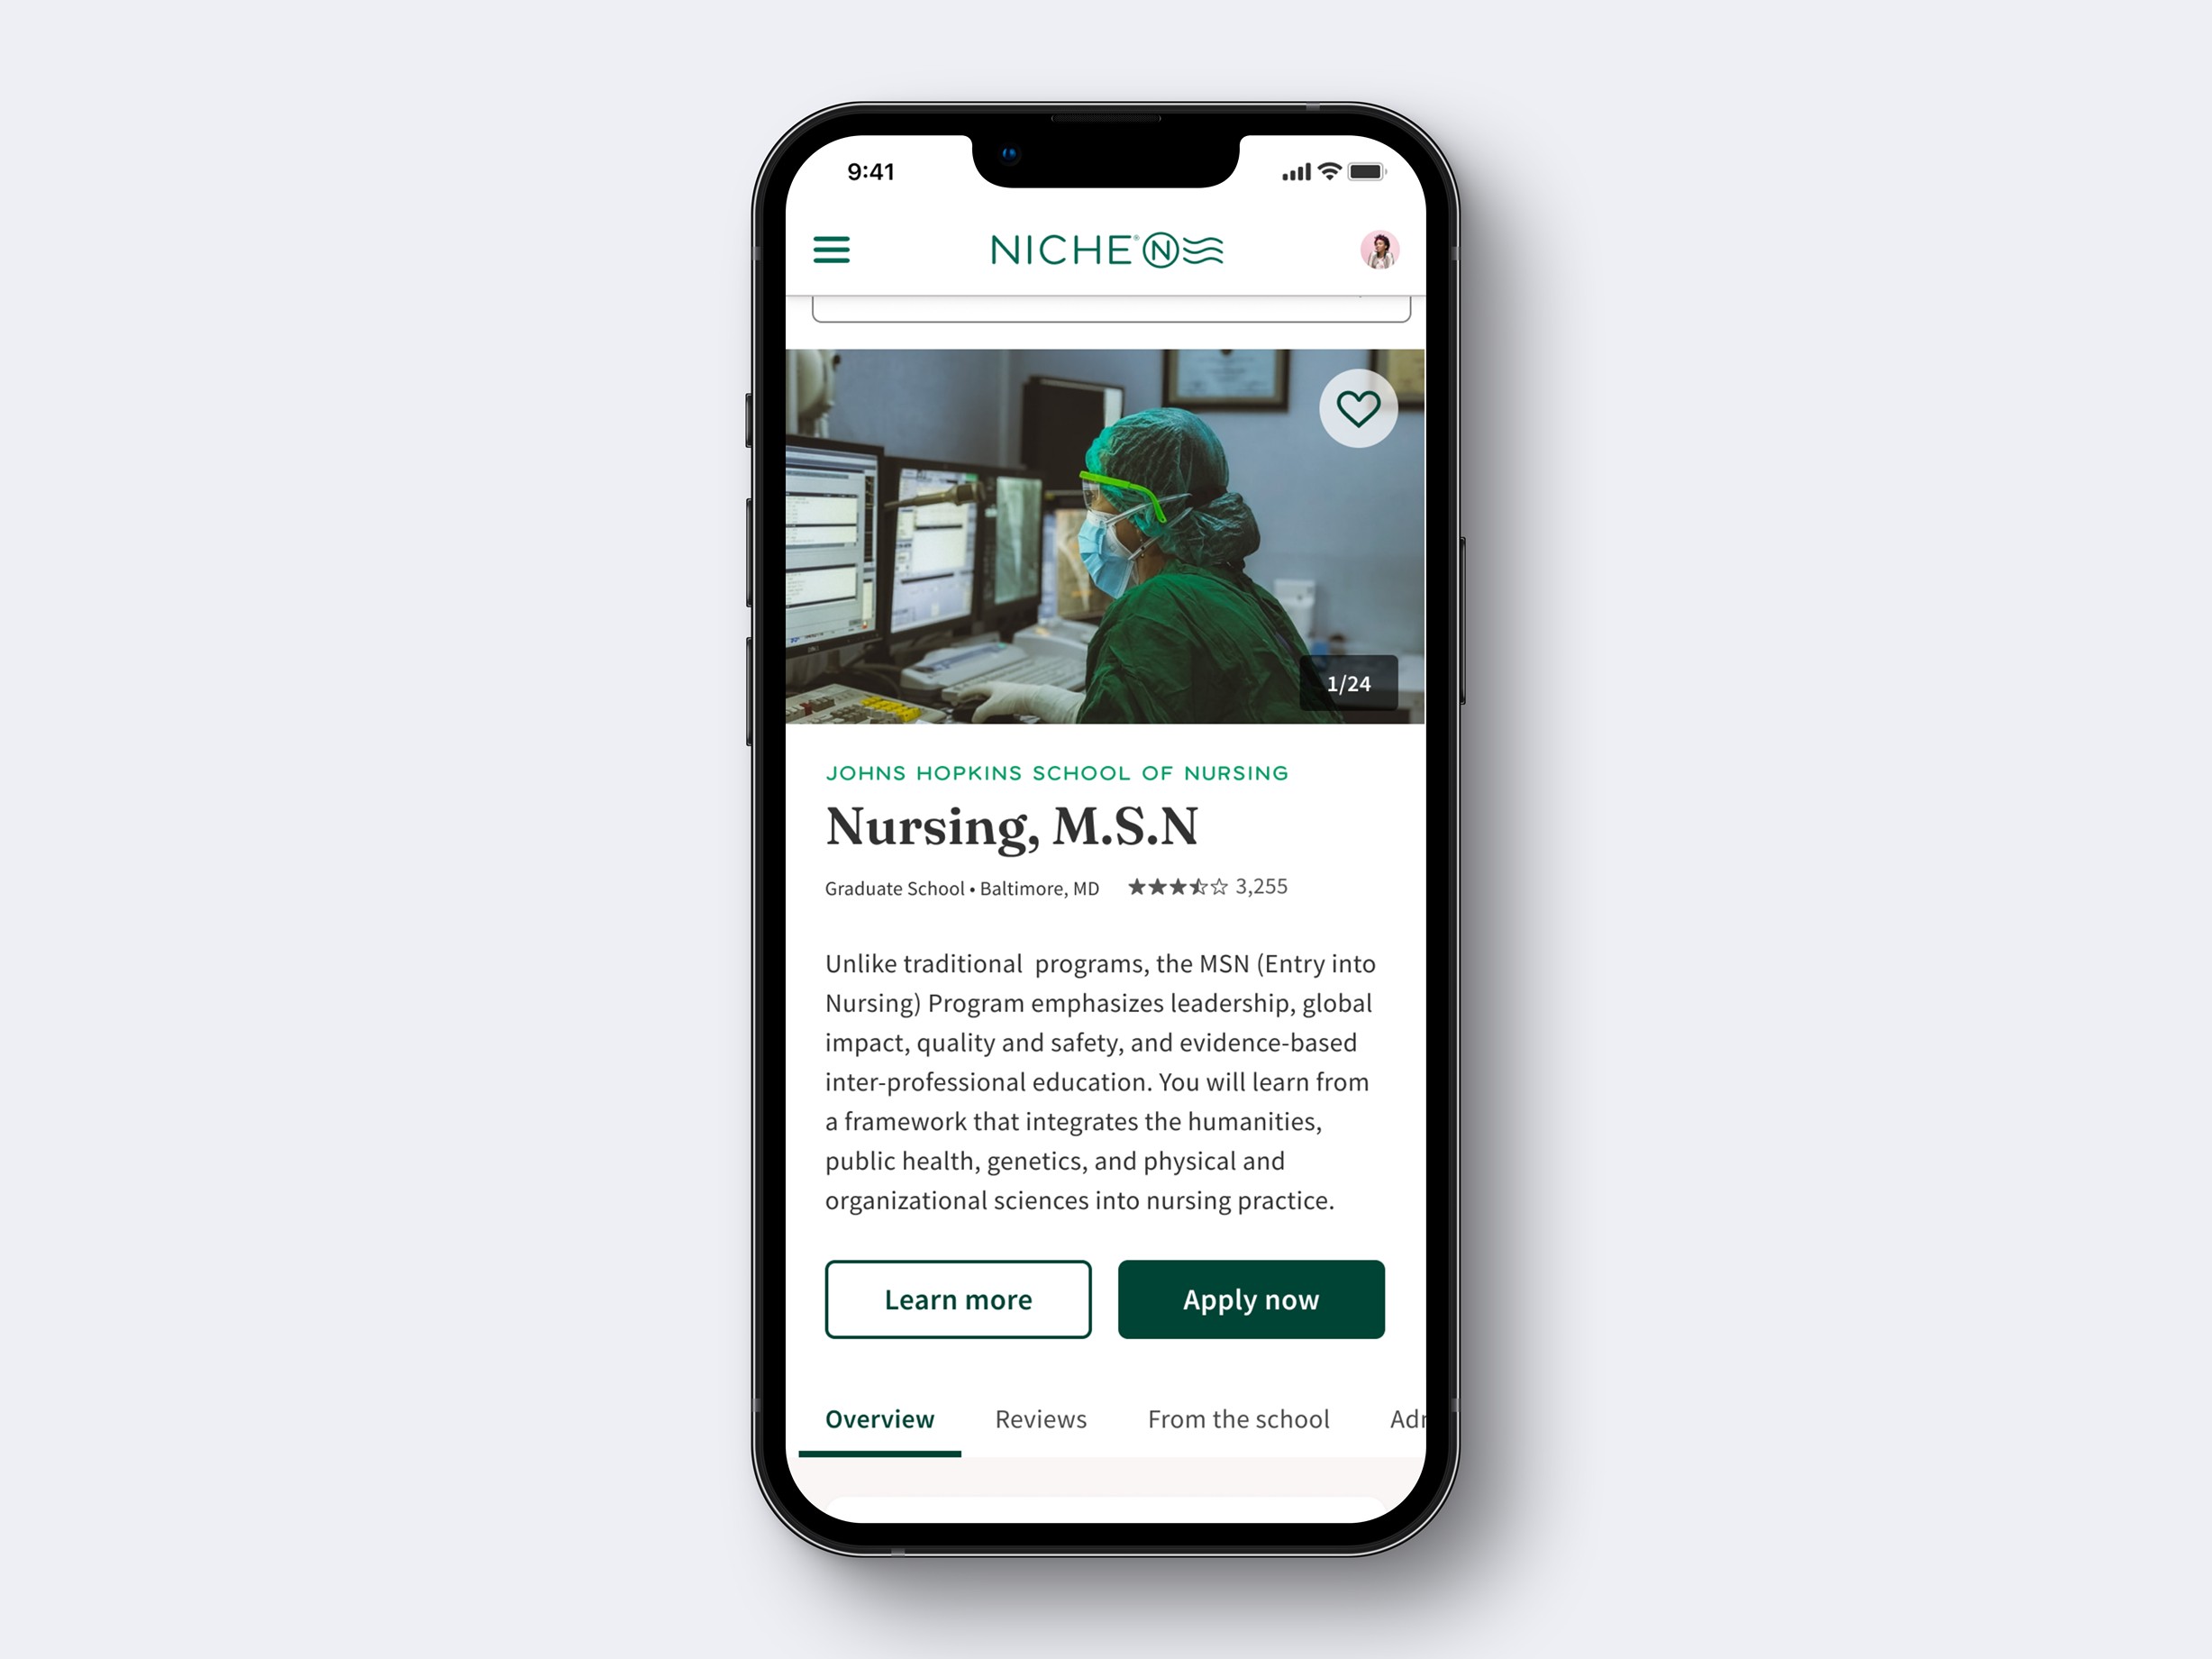
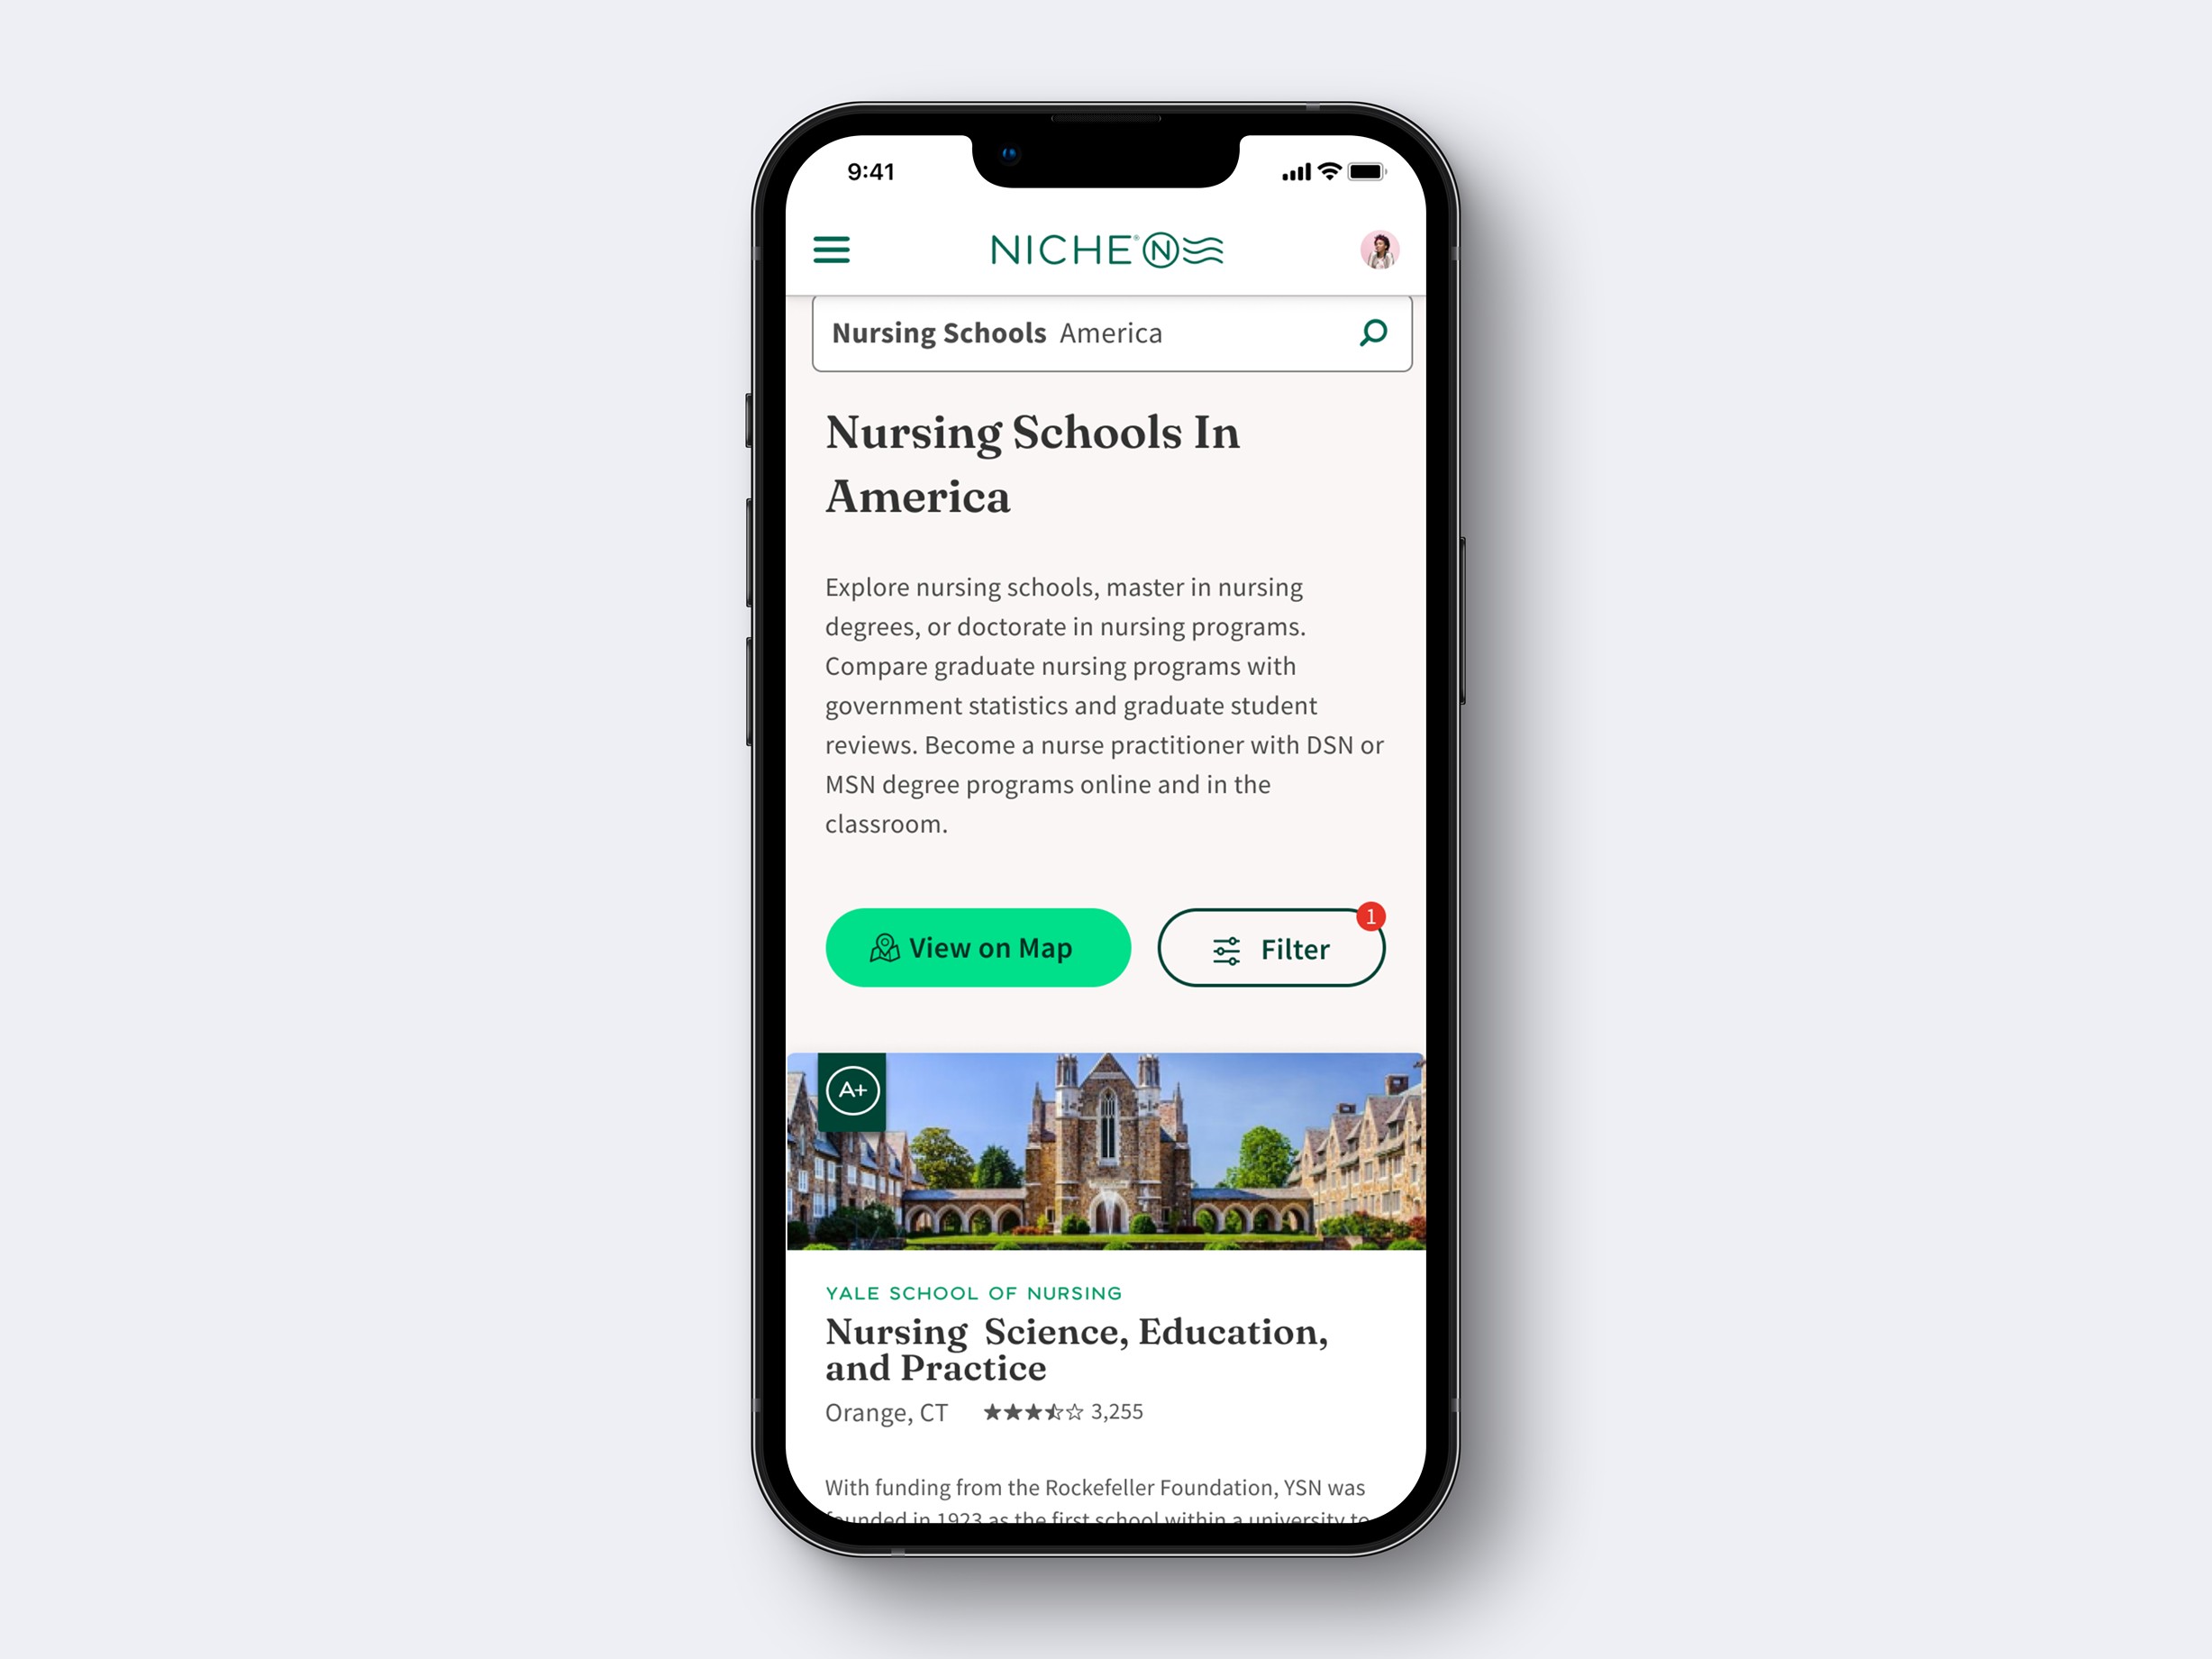
After consolidating all of our research and strategizing the two-year vision for the Grad vertical, the team decided to create small "featured program" cards to allow schools to highlight key information about their programs and make Niche the centralized place to compare all programs across schools in the United States
It seemed like a simple step, but ultimately this led to another conflict within the team, as we had to decide what information would best fit onto the card.
Some people were focused on what would be most helpful for students, while others were concerned about what would make Grad Schools the happiest. As the design lead on this project I had to navigate these conversations and find a compromise that worked best for everyone.
In the end, we decided to lean into the student experience, despite knowing it could make it harder to collect the information, because we theorized it would give us an edge in the market by giving us more unique information.
Thus, we included 5 key facts that students found most important: Average length of the program, the number of credits required, the accreditation bureau, tuition cost, and the average scholarship amount.
Once I had confirmed that the "cover photo" section was the optimal place to insert the new photo galleries, I had to solve some fairly significant design challenges.
First, I needed to strategize how to clearly communicate this update to clients, since it was altering a well-known feature.
Second, I needed to establish a clear delineation between "cover photos" and "gallery photos," since the former were still being used across other features. "Cover photos" were used within Banner Ads, Re-marketing Ads, and Search Pages, and it was important that Niche clients understood this would not change.
The final design solves these problems by maintaining the existing cover photo and drawing attention to the feature with a clear empty state. Then, once in the edit screen, "gallery photos" are separated from the existing "cover photo" and given their own set of rules.
After consolidating all of our research and strategizing the two-year vision for the Grad vertical, the team decided to create small "featured program" cards to allow schools to highlight key information about their programs and make Niche the centralized place to compare all programs across schools in the United States
It seemed like a simple step, but ultimately this led to another conflict within the team, as we had to decide what information would best fit onto the card.
Some people were focused on what would be most helpful for students, while others were concerned about what would make Grad Schools the happiest. As the design lead on this project I had to navigate these conversations and find a compromise that worked best for everyone.
In the end, we decided to lean into the student experience, despite knowing it could make it harder to collect the information, because we theorized it would give us an edge in the market by giving us more unique information.
Thus, we included 5 key facts that students found most important: Average length of the program, the number of credits required, the accreditation bureau, tuition cost, and the average scholarship amount.
Client experience
Designing the form
With the facts finalized, it was time to start designing the form administrators would use to create their programs. For this step, I worked closely with Mike Rawding, a FE engineer and the tech lead on our team, to think through the best way to accomplish this task using our existing design system.
We faced a few large challenges.
First, we needed to highlight the key benefits the card provided before asking clients to invest time filling it out. We also wanted to make the card easy to fill out and provide exit points so users could save their progress. Lastly we needed to ensure the feature was easily discoverable.
A modal with a PNG of a featured card to announce the feature
I partnered with the marketing team to ensure that all materials anouncing the new Highlighted Programs feature included a PNG of a finished card, so that clients could easily visualize the product before they got started. This was a low effort way to show the value of the card to first time users.
Splitting the form into 5 sections
To provide exit points, and allow users to save their progress if they didn’t have all the information at once, I broke the form into 5 sections.
Required fields (what we absolutely needed to save), Custom Information, Program Cost, Program Length, and Optional Fields
This would lower the cognitive load of the task and prevent people from losing unfinished work.
Progress indicator
To make the form easier to complete, I added a progress bar that tracks the number of sections users have completed. This helps the form appear shorter, since it encourages users to focus on completing sections rather than individual inputs and it allows us to progressively disclose inputs as they become relevant.
Markers to improve discoverability
Finally, to ensure the discoverability of this feature was strong, I added a New tag to the sub Nav, a warning for unfinished programs, and a status tag to help users visualize their Featured programs and incomplete programs.
This helps users see what programs are incomplete and motivates them to add more information. (Zeigarnik Effect)
The launch
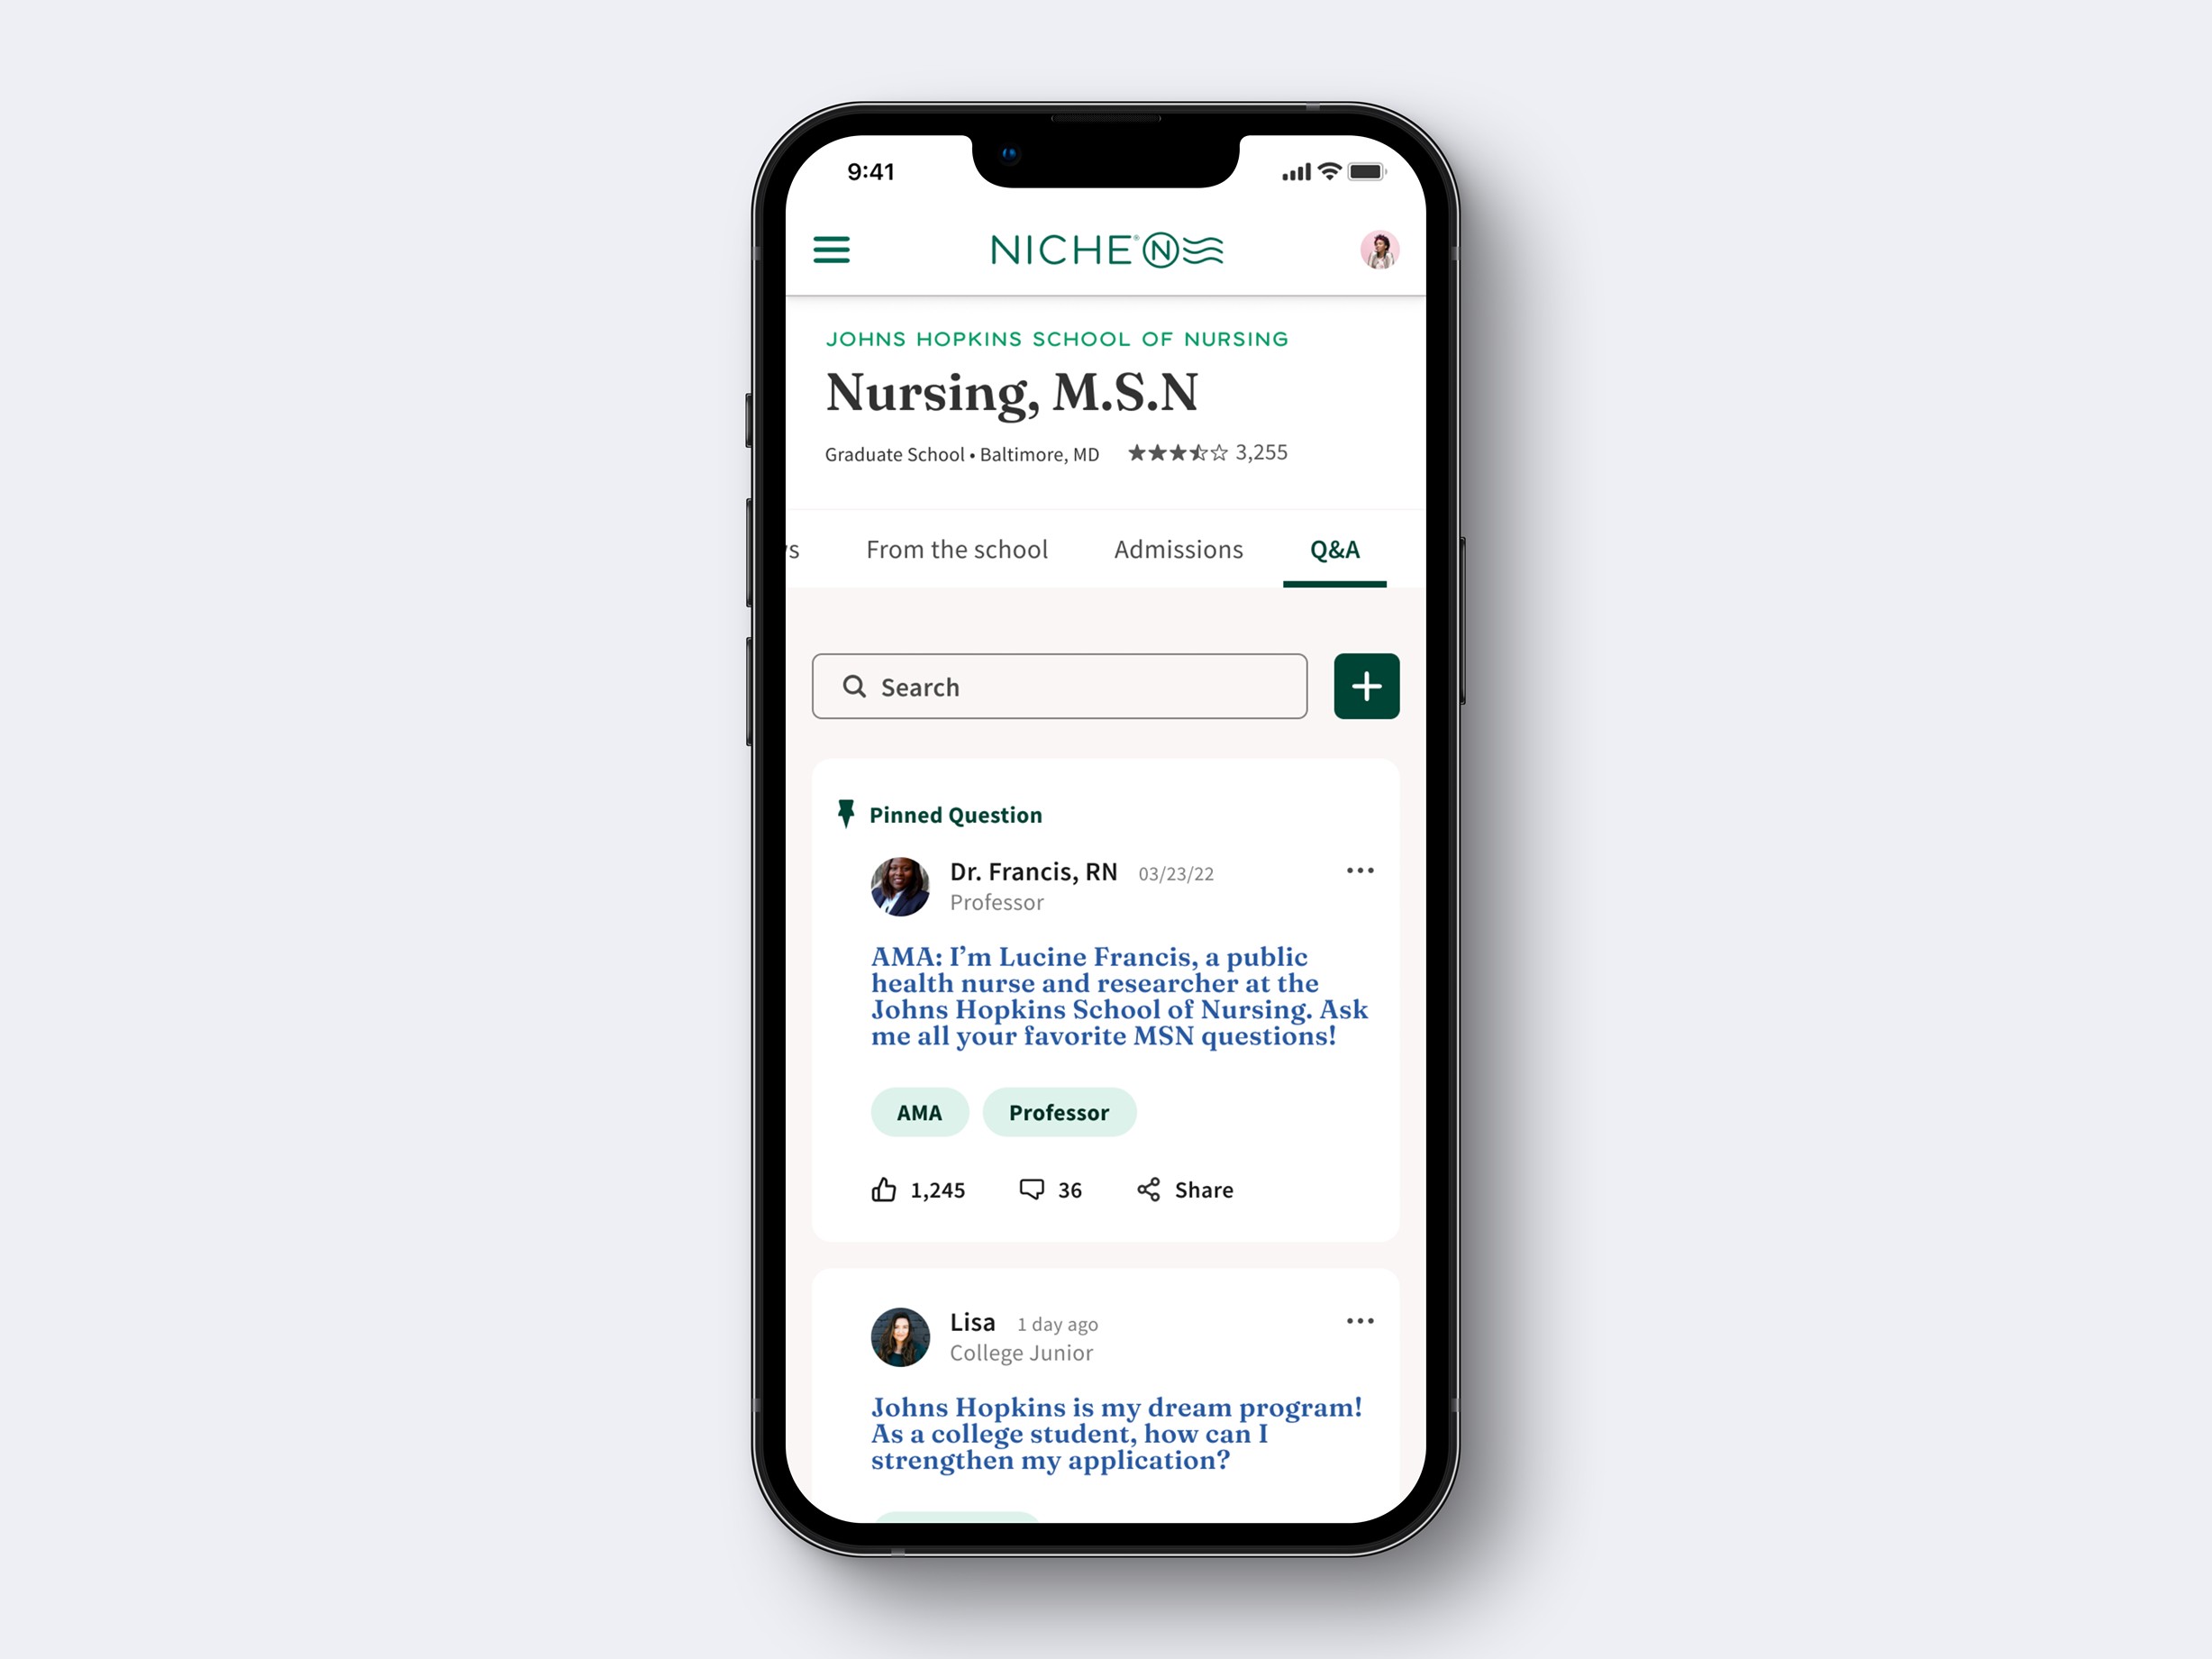
Unique Program Content
With the launch of this feature we are now collecting highly valuable program information on graduate school profiles.
We are hopeful that this feature will prove we can convince grad administrators to invest time in our website by adding key information and can drive up traffic on the user side.
872%
872%
872%
872%
Increase in traffic to Grad profiles
Increase in traffic to Grad profiles
Increase in traffic to Grad profiles
253+
253+
253+
253+
Spotlights created
Spotlights created
Spotlights created
6.2
6.2
6.2
6.2
AVG number of spotlights added to profiles
AVG number of spotlights added to profiles
AVG number of spotlights added to profiles
Coming out of the launch, we are very optimistic about this feature. On average schools have added 6.2 programs to their profile, indicating that clients who find the feature and heavily engaged and investing considerable time to add their content to the Niche website. In total, over 253 new highlighted programs have been created to date, and Niche is slowly becoming the "centralized place" to compare programs.
That being said, we expect the engagement to slow over time as schools
get all their programs on site, but we hope to continue to see the number of highlighted programs increase as less engaged clients find the feature and add their programs.
Feedback on the design? Want to chat over coffee? Find me on LinkedIn.
Experience
Alma
2023-Present
Product Designer
Niche
2021-2023
Product Designer
InnitData
2020-2021
Product Designer
RoasterTools
2018-2021
UX Consultant
Skills
Product Design
User Research
Product Analysis
Product Strategy
Systems Thinking
Communication & Collaboration
Design Thinking
Design Systems
User Research
Rapid Iteration
Adobe CS
Figma
© 2025 – all rights reserved